
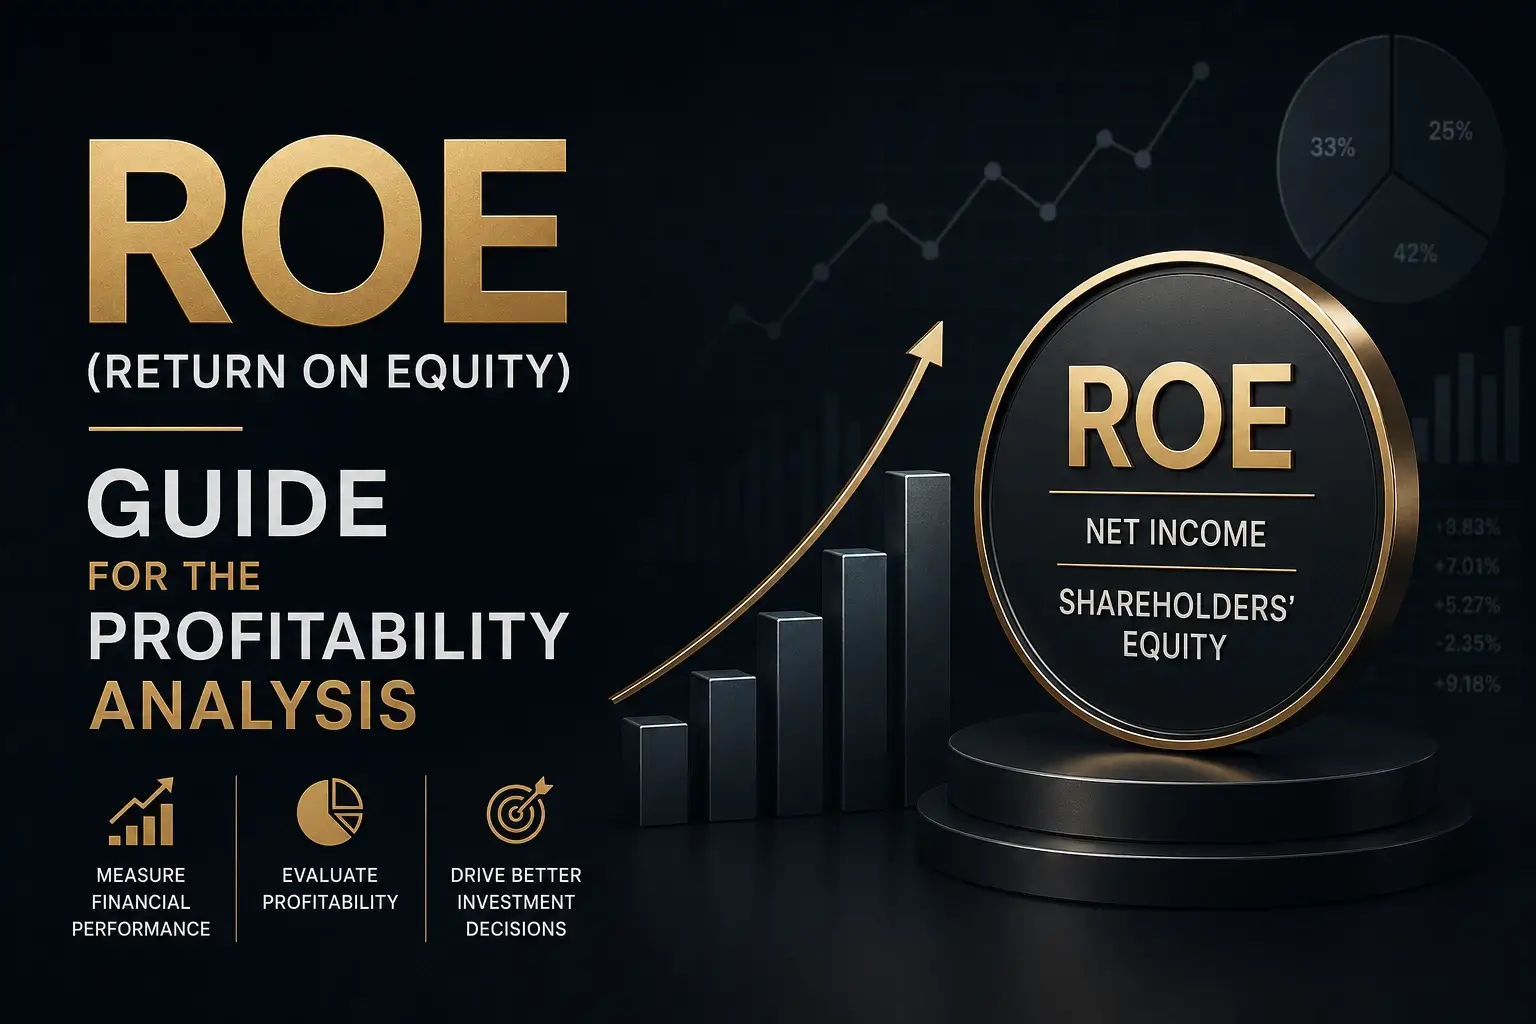
Understanding how efficiently a business converts shareholder capital into profit is at the heart of sound investment analysis. ROE (Return on Equity) stands as one of the most revealing financial ratios for this purpose, directly linking net income to shareholder equity to show the true earning power of a company. In this comprehensive guide, we unpack everything you need to know about ROE—from the basic Return on Equity formula and ROE calculation to advanced interpretation using the DuPont framework.
We also explore how ROE compares to related metrics such as ROI (Return on Investment), ROA, and profit margin, giving you a complete toolkit to evaluate financial performance, business efficiency, and company valuation. Whether you are an investor screening for quality compounders or a business leader aiming to improve operational returns, this article delivers the expert insights you need.
What Is ROE (Return on Equity)?
Every serious investor and business leader eventually asks the same question: how effectively is a company turning its shareholders’ money into profits? The answer lies in one of the most widely watched profitability ratios—ROE (Return on Equity). This metric distills a company’s financial performance into a single, powerful number that tells you how many dollars of net income a business generates for each dollar of shareholder equity.
Whether you are conducting investment analysis, benchmarking a company against its peers, or evaluating your own company’s business efficiency, understanding ROE (Return on Equity) is essential. It goes beyond surface-level earnings and reveals the true engine of shareholder value creation. In this comprehensive guide, we will walk you through the Return on Equity formula, practical ROE calculation, interpretation of high and low values, a detailed DuPont breakdown, limitations, and actionable improvement strategies.
Definition and Importance of ROE
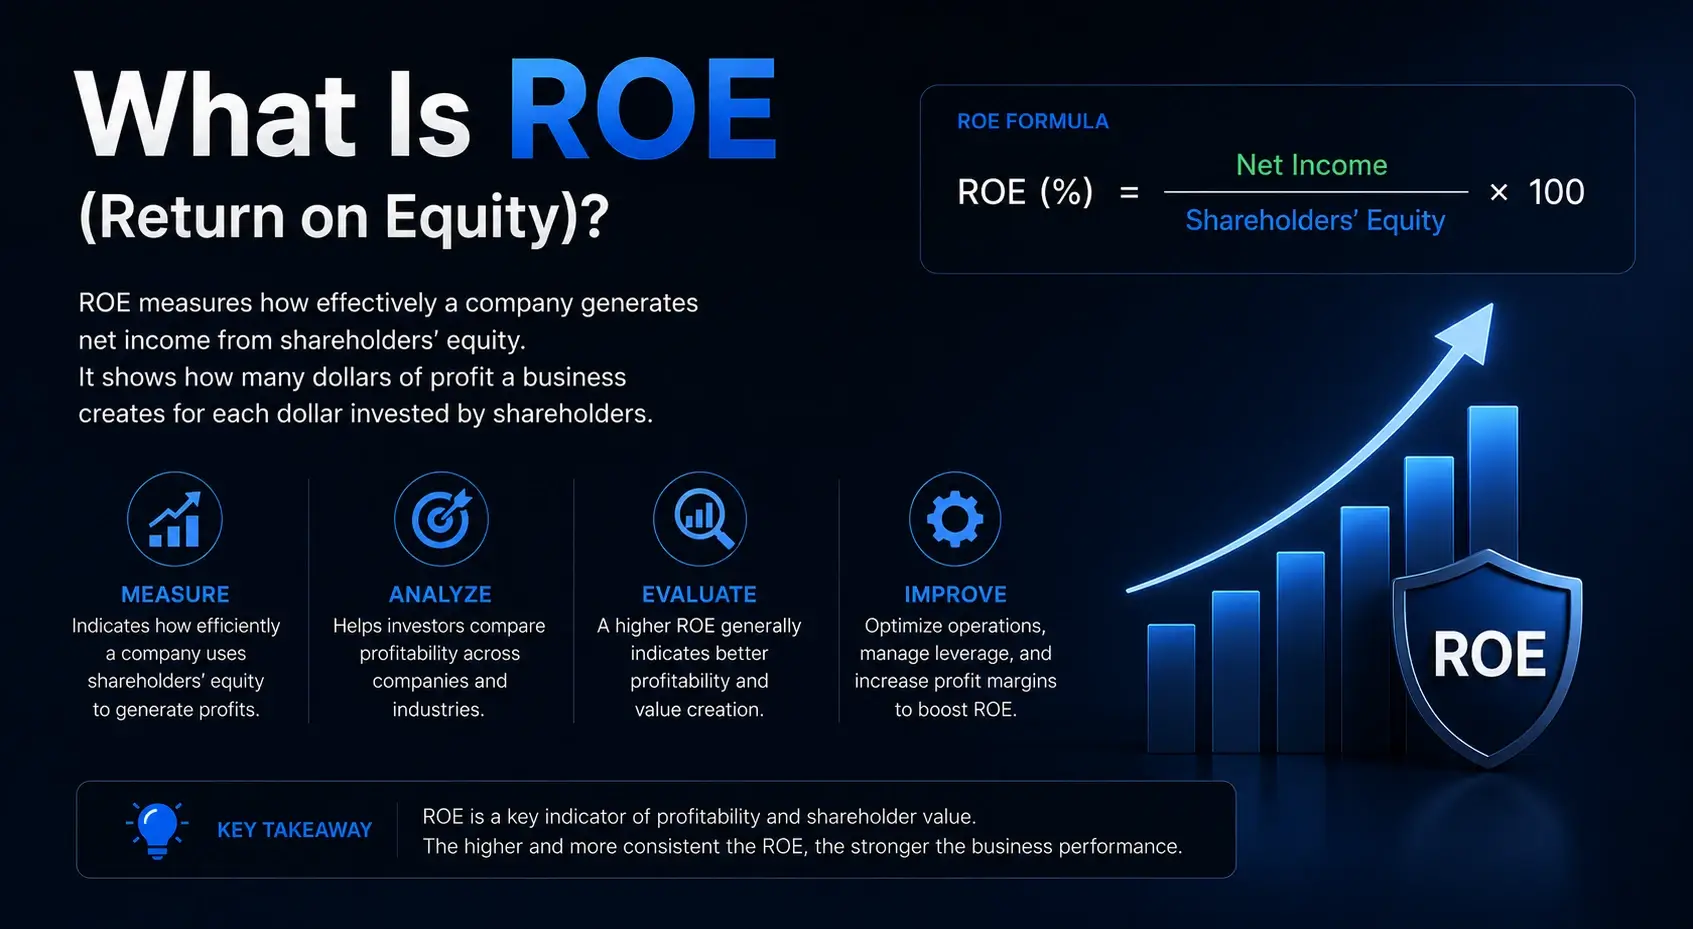
ROE (Return on Equity) is a financial ratio that measures how efficiently a company uses the equity contributed by its shareholders to generate net income. In simple terms, it answers: “For every dollar of equity, how much profit did the company earn?”
Mathematically, the ratio is expressed as a percentage. A 15% ROE means the firm created 15 cents of earnings for each dollar of shareholders’ capital during a given period. Because it directly ties profitability to the balance sheet, ROE is an indispensable tool in company valuation, helping analysts determine whether a business is worth its premium or discount.
Investors, creditors, and management track this metric relentlessly because it encapsulates three critical aspects of a business:
- Profit generation (net income)
- Operational efficiency (asset use)
- Financial leverage (debt management)
For private businesses, ROE serves as a benchmark for internal financial performance targets. For public companies, it is often a leading indicator of long-term stock returns.
ROE Formula and How to Calculate Return on Equity
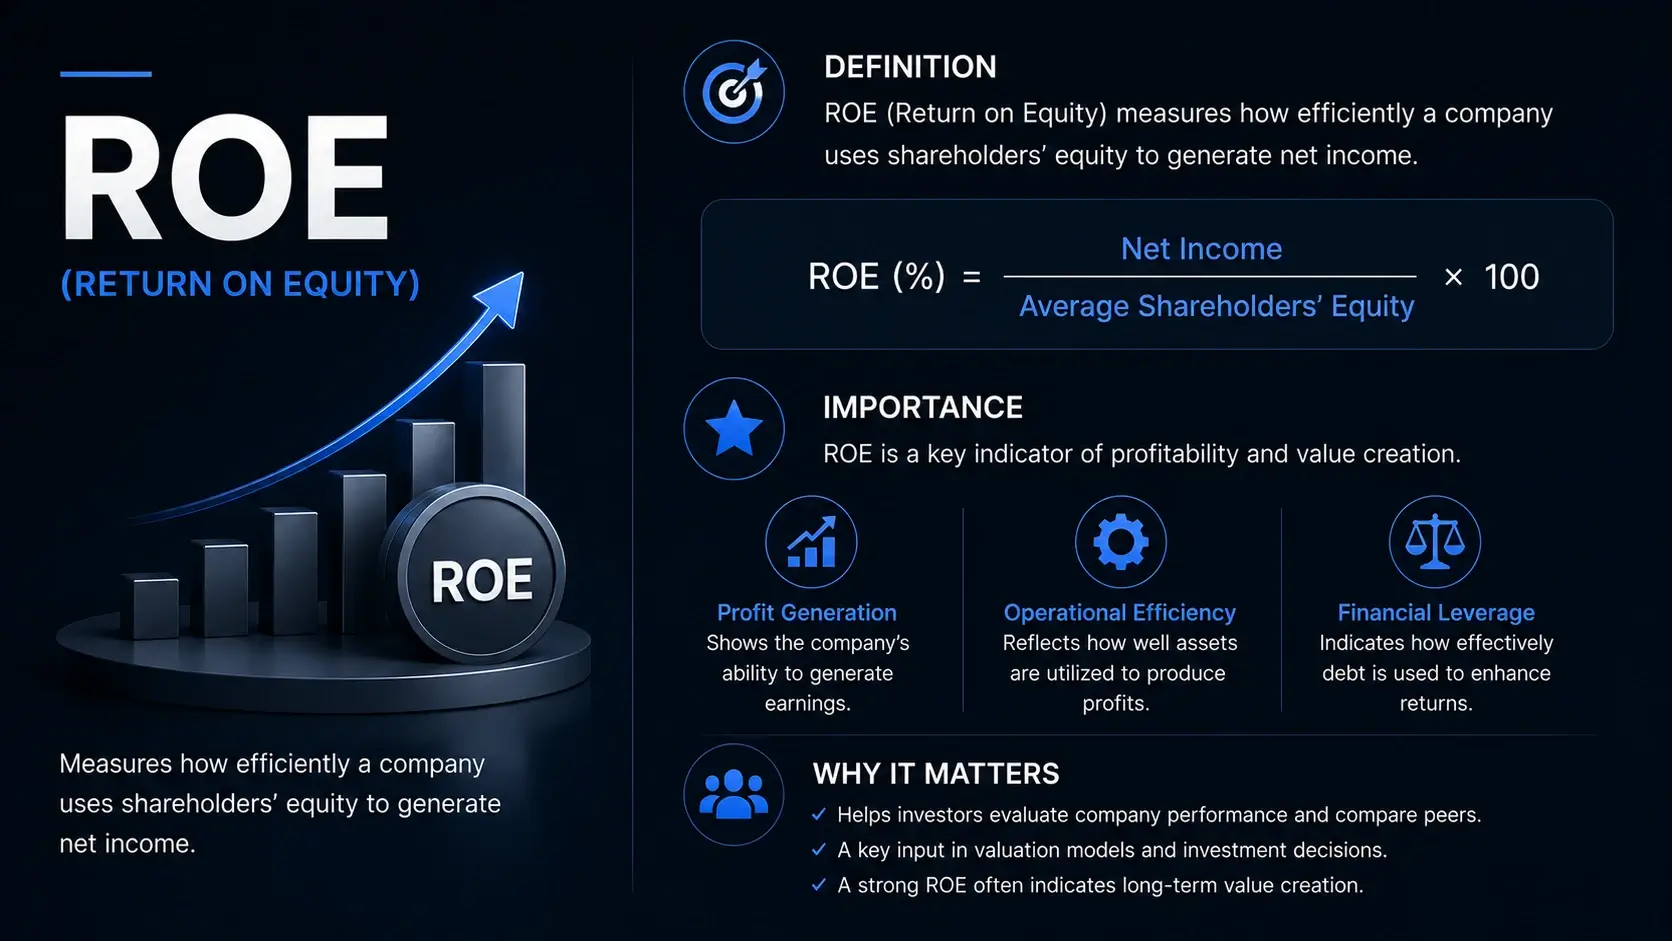
The standard Return on Equity formula is straightforward:
ROE = Net Income ÷ Average Shareholders’ Equity × 100
- Net Income is the bottom-line profit after all expenses, taxes, and preferred dividends (if any) have been subtracted. It appears on the income statement.
- Shareholder Equity is total assets minus total liabilities, found on the balance sheet. When calculating ROE over a period, many analysts use the average equity (beginning equity + ending equity divided by two) to account for changes during the year.
A basic ROE calculation example: if a company reports net income of $2 million and its average shareholder equity stands at $10 million, its ROE is 20%. This single figure gives a snapshot of how effectively the firm is converting its equity base into earnings.
Understanding the Components of ROE
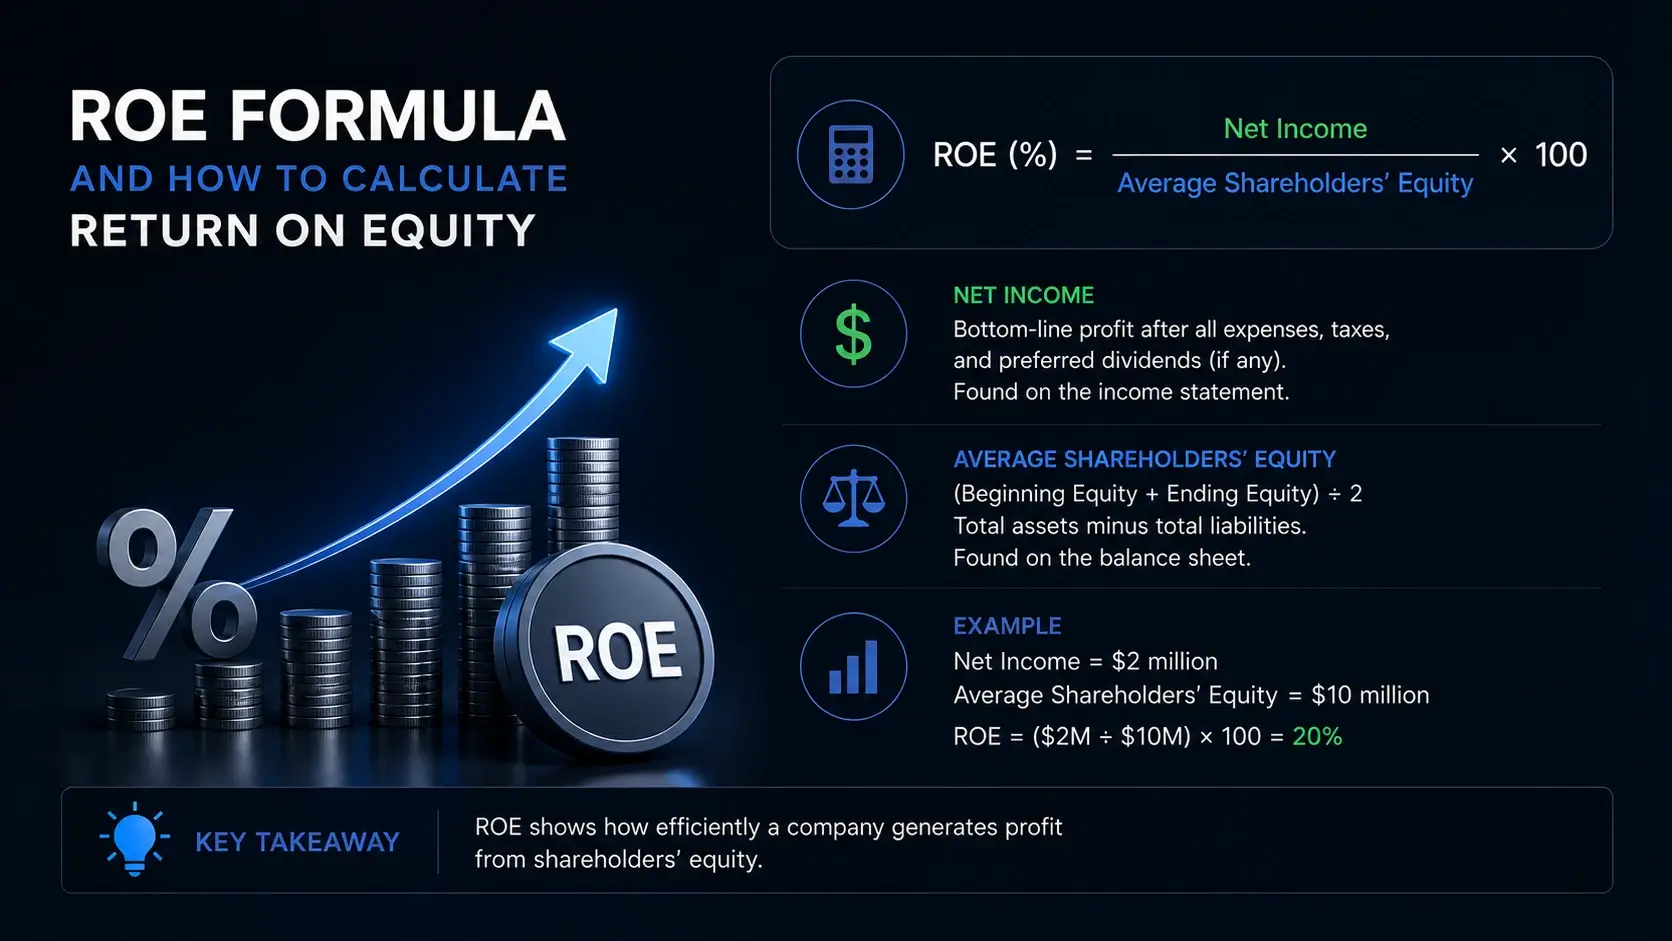
To truly interpret ROE (Return on Equity), you must look under the hood at its two main components.
Net Income
Net income is the profit available to common shareholders after all operating expenses, interest, taxes, and depreciation. It is the reward for taking on business risk. A rising net income, all else being equal, will directly push ROE higher. However, net income can be influenced by one‑time gains or accounting choices, so evaluating its quality is crucial.
Shareholder Equity
Shareholders’ equity represents the owners’ residual claim on assets after all liabilities are settled. It includes common stock, retained earnings, and additional paid‑in capital, minus treasury shares. A company that retains earnings and grows its equity base through profitable reinvestment will see equity increase. If net income grows faster than equity, ROE expands, signalling heightened business efficiency.
Why ROE Is Important for Investors and Businesses
ROE (Return on Equity) occupies a unique place in financial analysis because it connects the income statement directly to the balance sheet. Here is why it matters:
- For investors: A consistently high ROE is often a hallmark of a durable competitive advantage. It suggests management can deploy capital effectively without needing to dilute shareholders. In investment analysis, ROE helps filter companies that are compounding intrinsic value at attractive rates.
- For business owners: ROE acts as a profitability ratio that reveals whether a business is generating acceptable returns on the money invested by its owners. It guides decisions on dividend policy, expansion, and capital structure.
- For creditors: A solid ROE indicates a cushion of profitability that supports debt repayment, making the firm a safer credit risk.
- For valuation: Many valuation models, such as the justified price‑to‑book ratio, use ROE as a central input, linking current performance to future growth and market expectations.
How to Interpret ROE Results
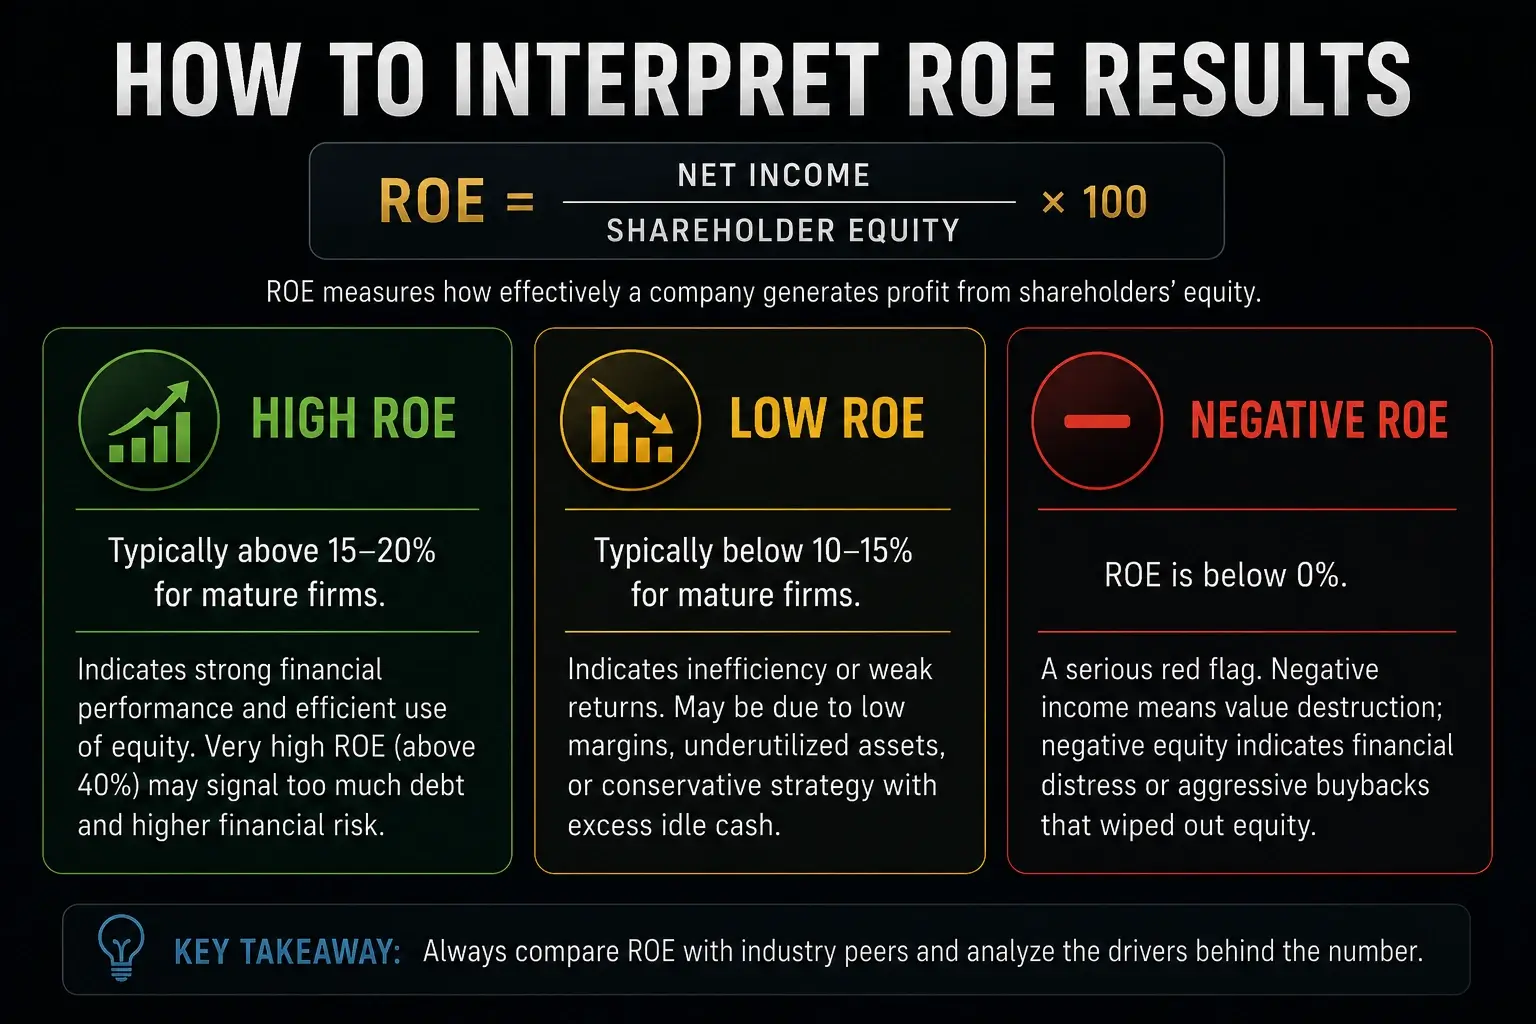
Interpreting ROE demands context. The same ROE value can be excellent in one industry and mediocre in another.
High ROE
A high ROE (typically above 15‑20% for mature firms) indicates strong financial performance. It may stem from exceptional profit margins, efficient asset turnover, or significant financial leverage. However, an extremely high ROE—say above 40%—can sometimes be a warning sign. If it is driven by excessive debt, the equity base shrinks (due to high liabilities relative to assets), artificially inflating the ratio while increasing financial risk.
Low ROE
A low or declining ROE points to inefficiency. The company may be struggling to generate adequate returns on its equity. This could be due to thin profit margins, underutilized assets, or an overly conservative capital structure with too much idle cash. It may signal that management should consider share buybacks or re‑evaluate its growth strategy.
Negative ROE
A negative ROE occurs when net income is negative or when shareholder equity turns negative (liabilities exceed assets). Both are serious red flags. Negative earnings mean the business is destroying shareholder value, while negative equity often implies deep financial distress or aggressive share repurchases that have wiped out retained earnings.
Factors That Affect ROE
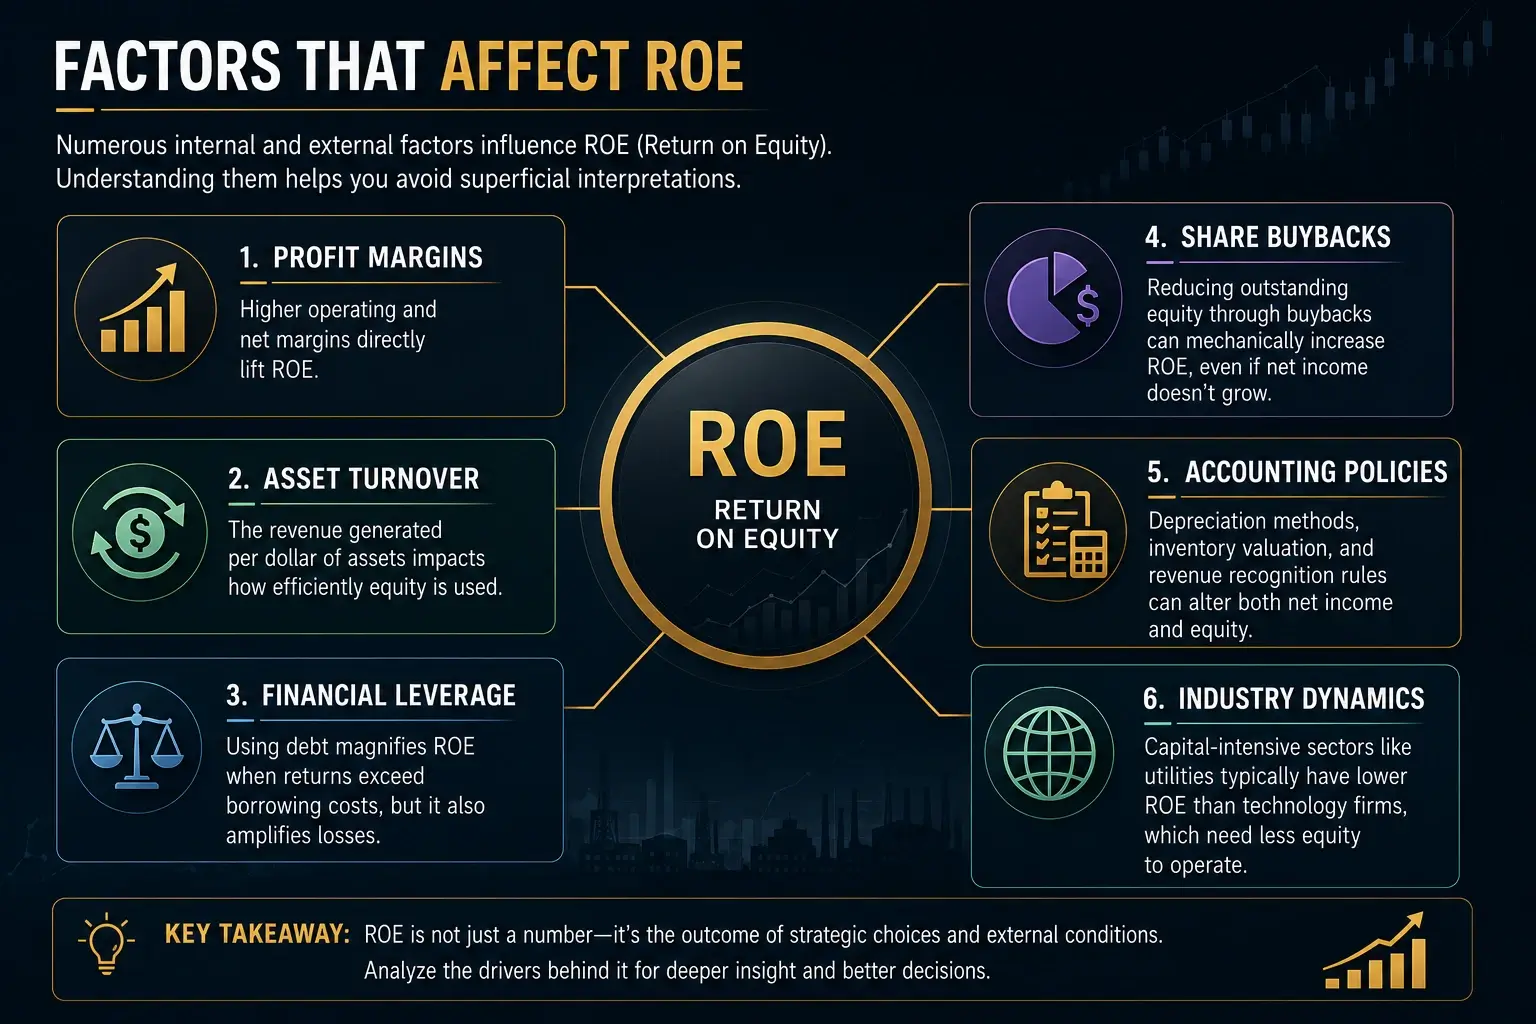
Numerous internal and external factors influence ROE (Return on Equity). Understanding them helps you avoid superficial interpretations.
- Profit margins: Higher operating and net margins directly lift ROE.
- Asset turnover: The revenue generated per dollar of assets impacts how efficiently equity is used.
- Financial leverage: Using debt magnifies ROE when returns exceed borrowing costs, but it also amplifies losses.
- Share buybacks: Reducing outstanding equity through buybacks can mechanically increase ROE, even if net income doesn’t grow.
- Accounting policies: Depreciation methods, inventory valuation, and revenue recognition rules can alter both net income and equity.
- Industry dynamics: Capital‑intensive sectors like utilities typically have lower ROE than technology firms, which need less equity to operate.
ROE vs Other Financial Ratios
No single ratio tells the whole story. Comparing ROE to other financial ratios adds depth to your analysis.
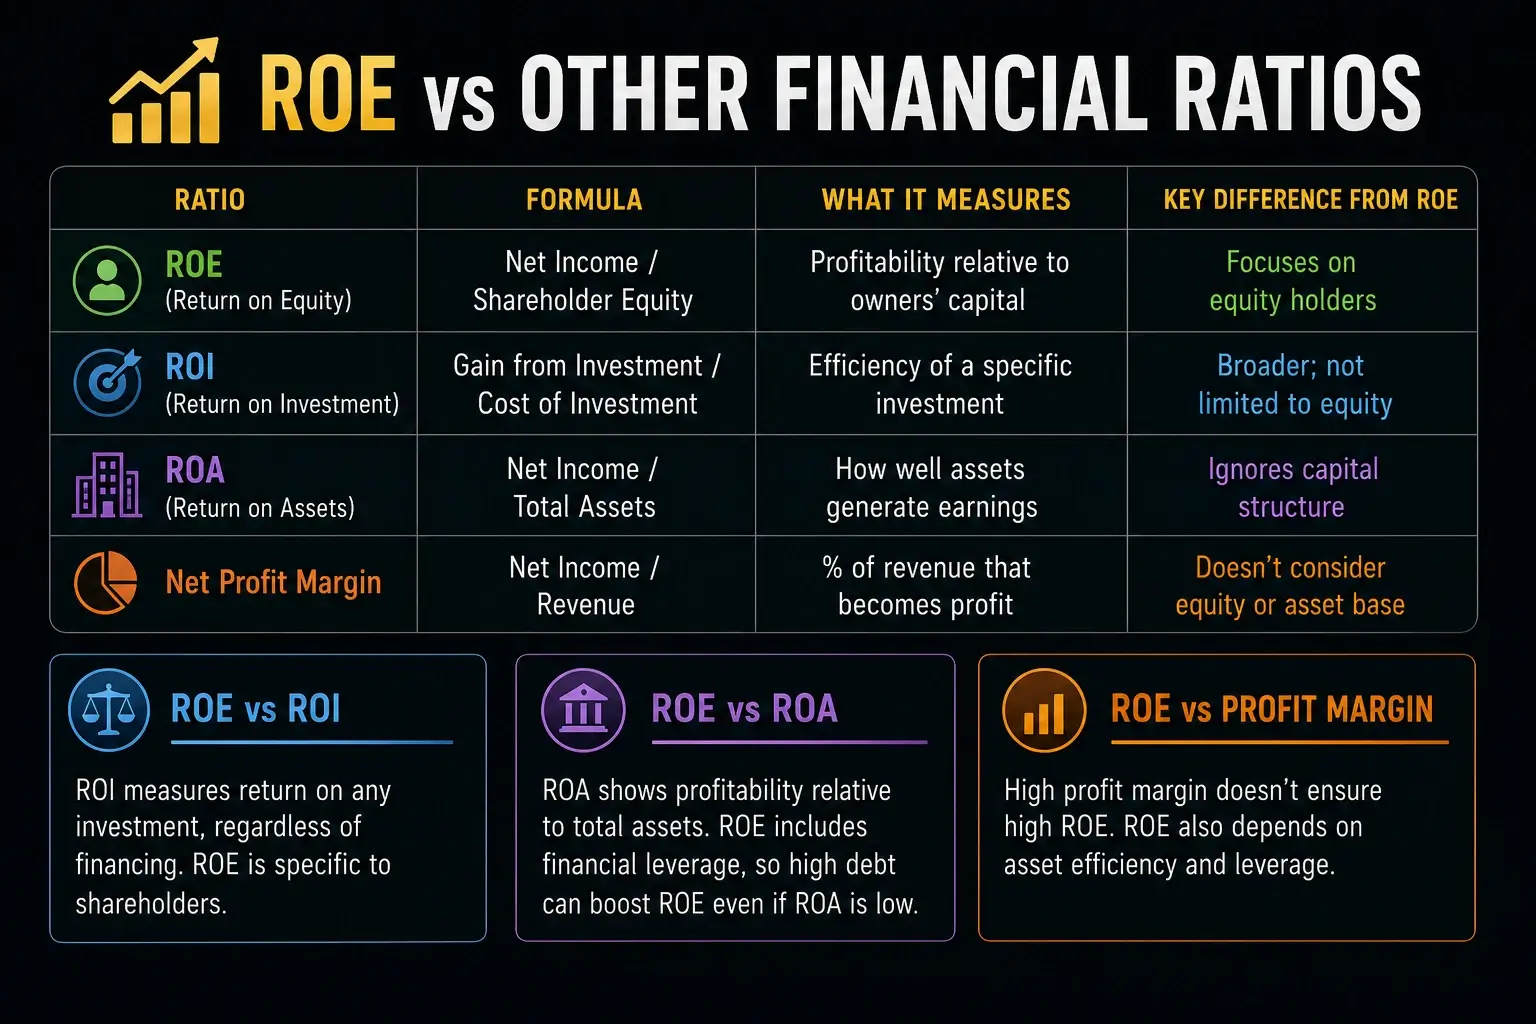
| Ratio | Formula | What It Measures | Key Difference from ROE |
|---|---|---|---|
| ROE (Return on Equity) | Net Income / Shareholder Equity | Profitability relative to owners’ capital | Focuses on equity holders |
| ROI (Return on Investment) | Gain from Investment / Cost of Investment | Efficiency of a specific investment | Broader; not limited to equity |
| ROA (Return on Assets) | Net Income / Total Assets | How well assets generate earnings | Ignores capital structure |
| Net Profit Margin | Net Income / Revenue | Percentage of revenue that becomes profit | Doesn’t consider the equity or asset base |
ROE vs ROI
ROI (Return on Investment) measures the return on any particular investment, irrespective of financing. ROE, on the other hand, is specific to shareholders. A project might have a high ROI but still dilute overall ROE if it is financed with expensive equity.
ROE vs ROA
ROA tells you how profitable a company is relative to its total assets, without distinguishing between debt and equity financing. Because ROE incorporates financial leverage, a firm with high debt can show a strong ROE while its ROA remains modest. Comparing the two reveals how much debt is boosting shareholder returns.
ROE vs Profit Margin
A high profit margin doesn’t guarantee a high ROE. A luxury brand might have a 25% net margin but a massive equity base, yielding a moderate ROE. Conversely, a grocery chain with a 3% margin can achieve a stellar ROE through high inventory turnover and prudent leverage. ROE adds the dimension of efficiency that profit margin alone misses.
DuPont Analysis and ROE Improvement Strategies
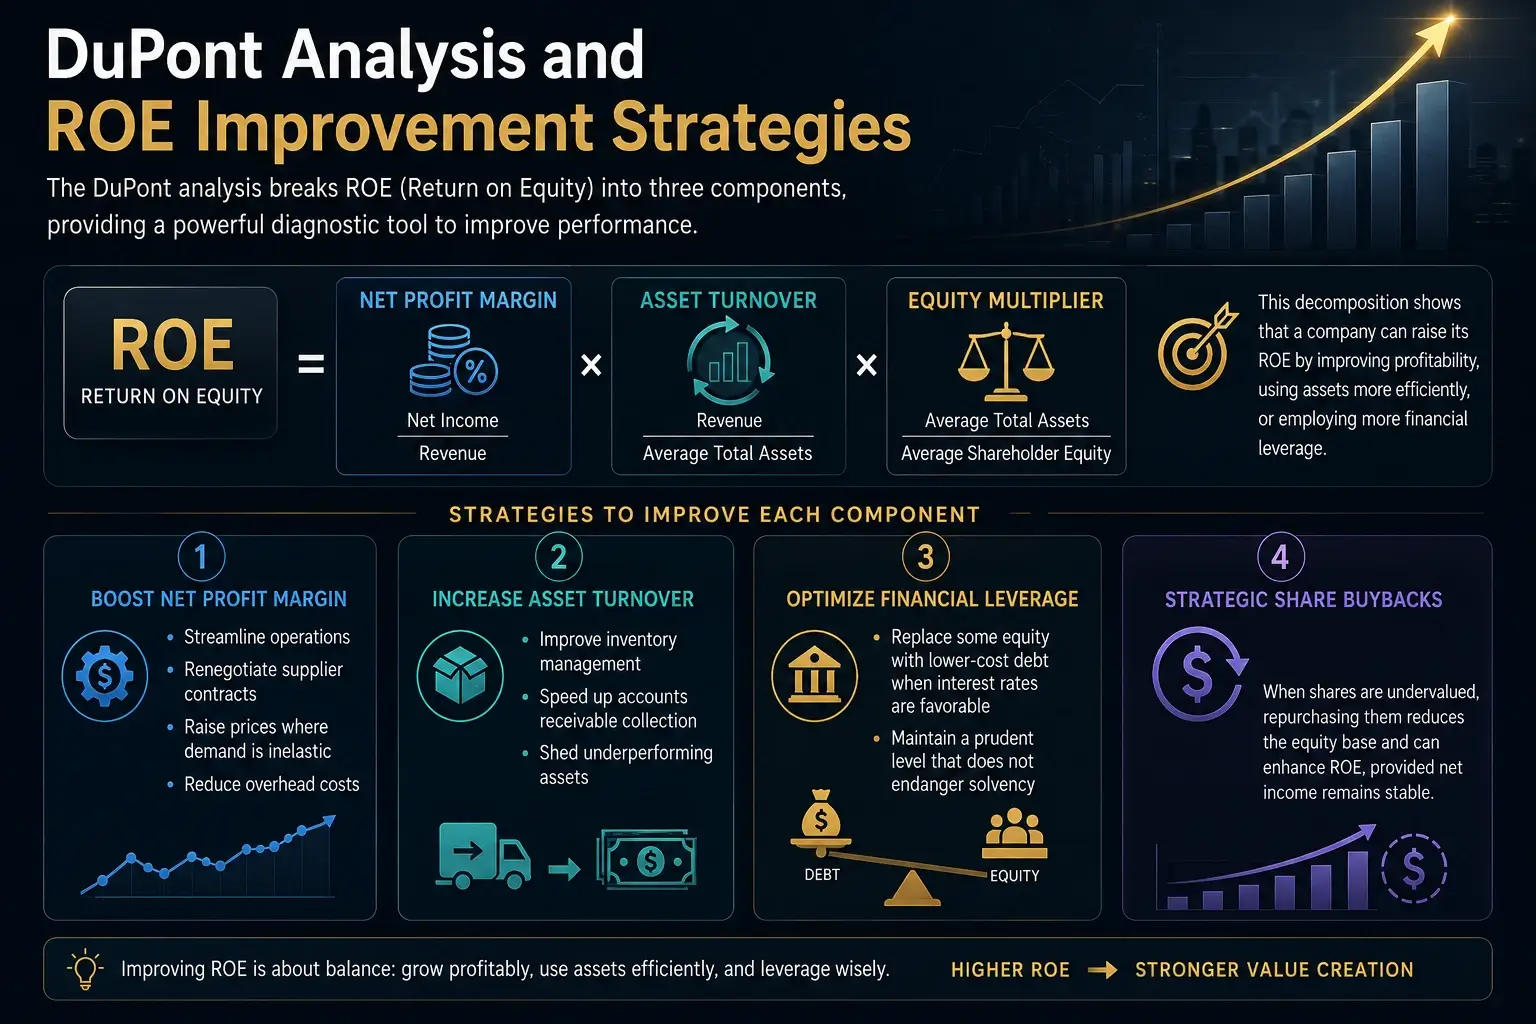
The DuPont analysis breaks ROE (Return on Equity) into three components, providing a powerful diagnostic tool:
ROE = Net Profit Margin × Asset Turnover × Equity Multiplier
- Net Profit Margin = Net Income / Revenue
- Asset Turnover = Revenue / Average Total Assets
- Equity Multiplier = Average Total Assets / Average Shareholder Equity
This decomposition shows that a company can raise its ROE by increasing profit margins, using assets more efficiently to generate sales, or employing more financial leverage.
Strategies to Improve Each Component
- Boost net profit margin: Streamline operations, renegotiate supplier contracts, raise prices where demand is inelastic, or reduce overhead costs.
- Increase asset turnover: Improve inventory management, speed up accounts receivable collection, and shed underperforming assets.
- Optimize financial leverage: Replace some equity with lower‑cost debt when interest rates are favourable, but only to a prudent level that does not endanger solvency.
- Strategic share buybacks: When shares are undervalued, repurchasing them reduces the equity base and can enhance ROE, provided net income remains stable.
Practical ROE Calculation Example
Let’s put the numbers to work with a real‑world ROE calculation.
Company XYZ Ltd.
- Net income (year ended 2025): $4,500,000
- Shareholder equity (Jan 1, 2025): $18,000,000
- Shareholder equity (Dec 31, 2025): $22,000,000
- Revenue: $60,000,000
- Total assets (average): $40,000,000
Step 1 – Compute Average Equity
Average equity = ($18,000,000 + $22,000,000) / 2 = $20,000,000
Step 2 – Calculate ROE
ROE = $4,500,000 / $20,000,000 = 22.5%
Step 3 – DuPont Decomposition
- Net Profit Margin = 4,500,000 / 60,000,000 = 7.5%
- Asset Turnover = 60,000,000 / 40,000,000 = 1.5
- Equity Multiplier = 40,000,000 / 20,000,000 = 2.0
Multiplying: 7.5% × 1.5 × 2.0 = 22.5% – exactly the ROE.
This breakdown reveals that Company XYZ’s ROE benefits from reasonable leverage (equity multiplier of 2.0) and a solid asset turnover, while its net margin is moderate. Management might explore margin improvement to raise ROE further without increasing debt.
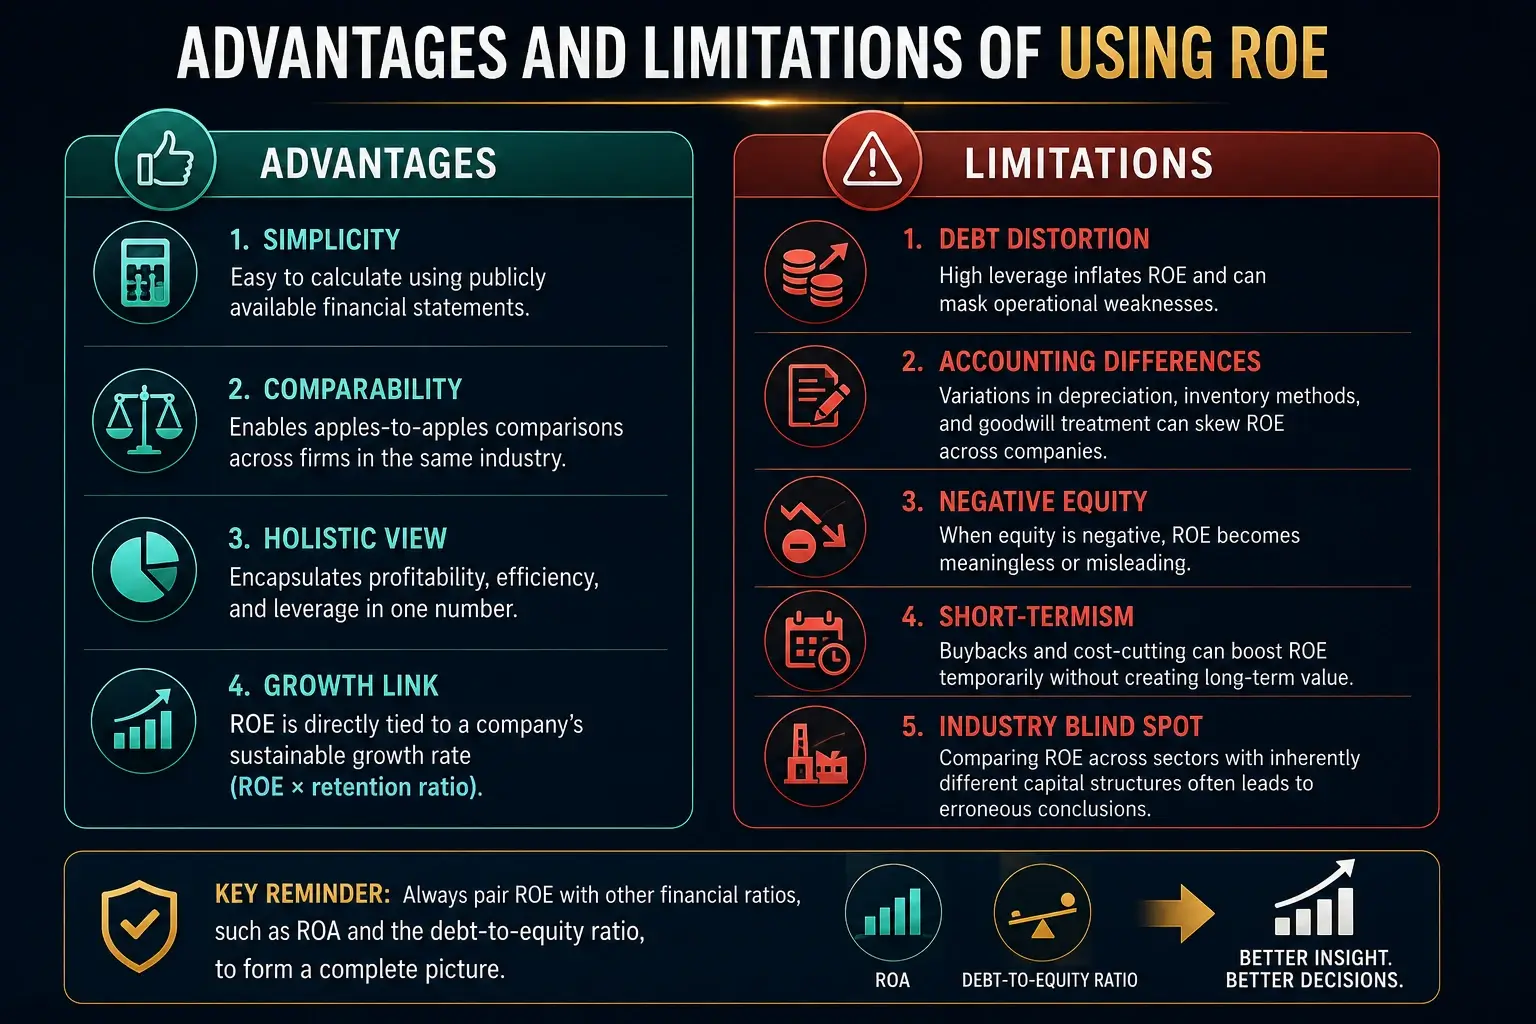
Advantages and Limitations of Using ROE
Advantages
- Simplicity: Easy to calculate using publicly available financial statements.
- Comparability: Enables apples‑to‑apples comparisons across firms in the same industry.
- Holistic view: Encapsulates profitability, efficiency, and leverage in one number.
- Growth link: ROE is directly tied to a company’s sustainable growth rate (ROE × retention ratio).
Limitations
- Debt distortion: High leverage inflates ROE and can mask operational weaknesses.
- Accounting differences: Variations in depreciation, inventory methods, and goodwill treatment can skew ROE across companies.
- Negative equity: When equity is negative, ROE becomes meaningless or misleading.
- Short‑termism: Buybacks and cost‑cutting can boost ROE temporarily without creating long‑term value.
- Industry blind spot: Comparing ROE across sectors with inherently different capital structures often leads to erroneous conclusions.
Always pair ROE with other financial ratios, such as ROA and the debt‑to‑equity ratio, to form a complete picture.
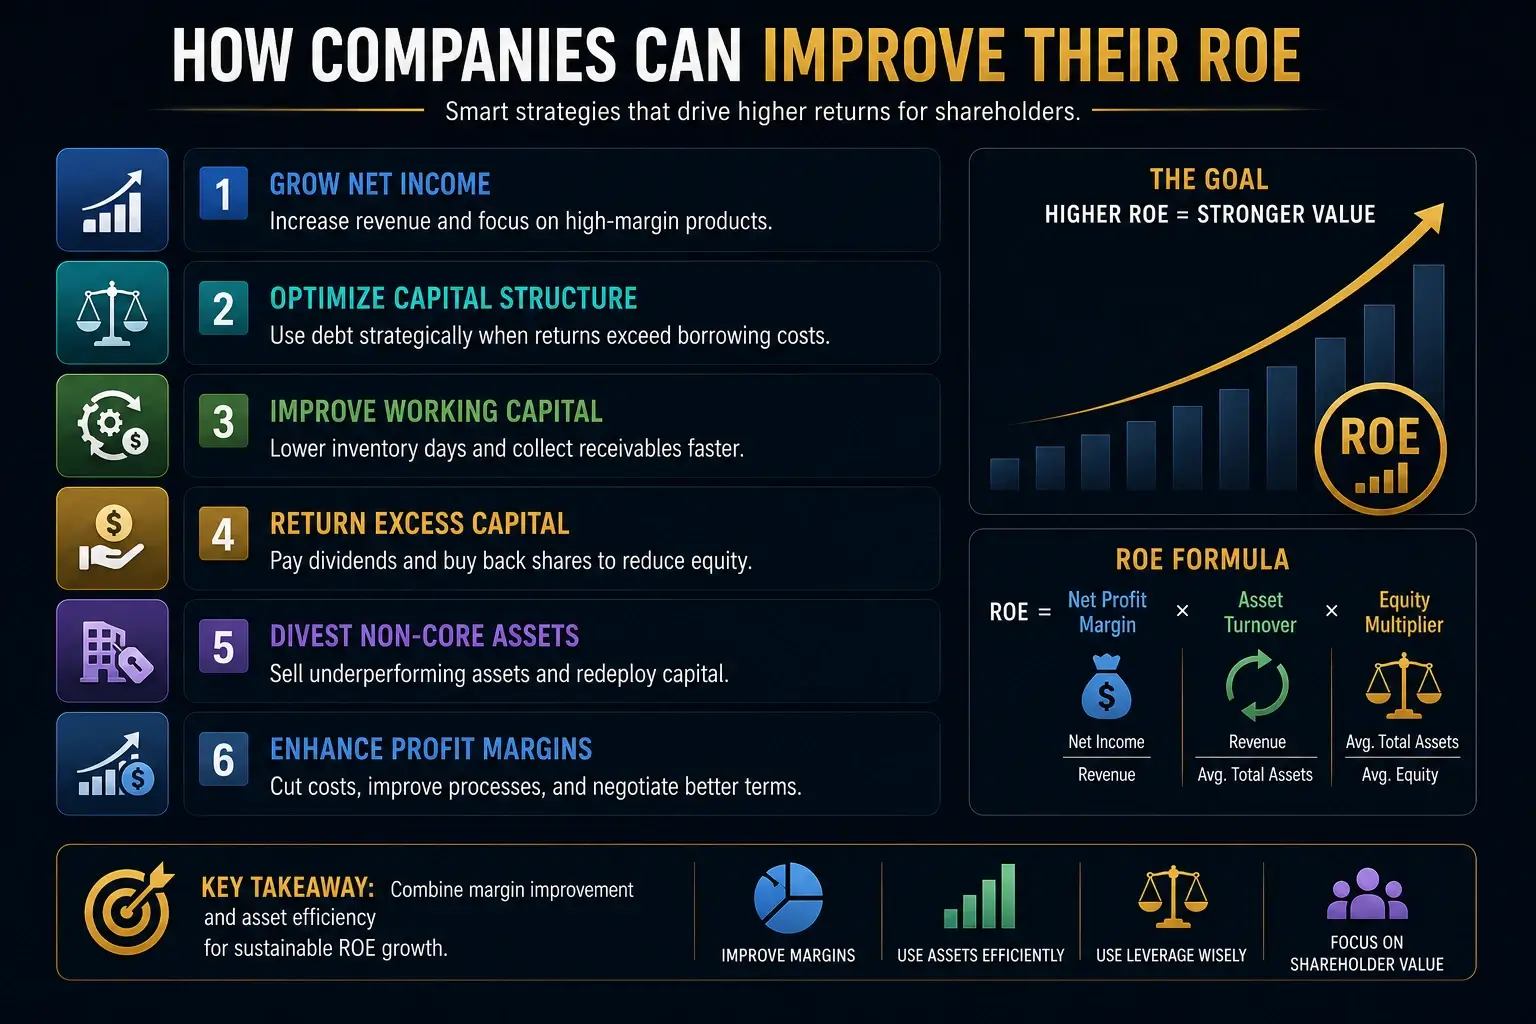
How Companies Can Improve Their ROE
A sustainable improvement in ROE (Return on Equity) demands strategic discipline. Here are proven levers:
- Grow net income faster than equity: Focus on high‑margin products, expand into new markets, or innovate to drive revenue growth without proportionally increasing the equity base.
- Optimize the capital structure: If the cost of debt is lower than the return on assets, strategically introducing debt can lift ROE while monitoring default risk.
- Aggressive working capital management: Reducing inventory days and accelerating receivables directly improve asset turnover.
- Return excess capital to shareholders: Dividend payments and share buybacks reduce equity and can enhance ROE, provided the remaining capital is deployed efficiently.
- Divest non‑core assets: Selling underperforming business units or idle assets increases asset turnover and frees up capital for higher‑return opportunities.
- Continuous margin enhancement: Adopt lean operations, automate processes, and negotiate better terms to widen profit margins.
A balanced approach that combines margin improvement and asset efficiency usually yields the most durable results.
Frequently Asked Questions (FAQ)
1. What is considered a good ROE?
A good ROE varies by industry. As a rule of thumb, an ROE above 15% is generally attractive for mature companies, while cyclical or high‑growth firms may show lower figures during investment phases. Compare against industry averages and historical trends.
2. How is ROE different from ROA?
ROE focuses on returns to shareholders, incorporating the effect of debt. ROA measures how efficiently a company uses its total assets, independent of capital structure. A wide gap between ROE and ROA often indicates significant leverage.
3. Can ROE be negative?
Yes. A negative ROE arises when a company reports a net loss or when shareholder equity is negative due to accumulated deficits or excessive borrowing. Negative ROE signals destruction of shareholder value.
4. How does debt affect ROE?
Debt can amplify ROE because it reduces the equity denominator. If the company earns a return on borrowed funds higher than the interest cost, ROE rises. However, too much debt increases financial risk and can lead to volatile earnings.
5. Why do banks and financial institutions have a different ROE benchmark?
Banks operate with high leverage by design, so their equity bases are thin relative to assets. An ROE of 10‑12% is often considered solid in banking, while a similar figure in manufacturing might be seen as mediocre.
6. How often should I calculate ROE?
ROE should be tracked quarterly and annually to spot trends. A single quarter may be distorted by seasonal effects, so it’s wise to look at trailing twelve‑month figures for a reliable view.
7. Does a high ROE always mean a good investment?
Not necessarily. A high ROE driven by massive debt or unsustainable cost cuts may mask underlying problems. Always dissect ROE using DuPont analysis and review cash flow trends.
Conclusion
ROE (Return on Equity) is far more than a simple profitability ratio; it is a lens through which you can view a company’s entire operational and financial strategy. From the basic Return on Equity formula to the nuanced DuPont decomposition, mastering ROE empowers you to judge financial performance, diagnose business efficiency, and make informed investment decisions.
Whether you’re an investor screening for quality compounders or a business leader steering a company toward higher shareholder value, keeping ROE at the centre of your financial analysis toolkit is non‑negotiable. Remember, the most valuable insights come not from the raw percentage alone, but from understanding what drives it—profit margins, asset use, and prudent leverage. Use ROE alongside other financial ratios, such as ROI (Return on Investment), ROA, and the debt‑to‑equity ratio, and you’ll be far better equipped to identify truly outstanding businesses.
References
The principles and methodologies discussed in this article are grounded in widely accepted financial theory and practice. The following authoritative sources provide deeper insight into the calculation, interpretation, and application of ROE and related financial ratios.
- Damodaran, A. (2012). Investment Valuation: Tools and Techniques for Determining the Value of Any Asset. 3rd ed. Wiley.
A seminal text covering valuation models, including the role of ROE in estimating growth and intrinsic value. - Penman, S. H. (2013). Financial Statement Analysis and Security Valuation. 5th ed. McGraw‑Hill.
A detailed guide to financial statement analysis, with extensive coverage of profitability ratios and the DuPont model. - Higgins, R. C. (2015). Analysis for Financial Management. 11th ed. McGraw‑Hill.
Explains financial ratio analysis, sustainable growth, and the strategic levers that influence ROE. - CFA Institute. (2023). CFA Program Curriculum Level I Volume 3: Financial Statement Analysis. Wiley.
The official curriculum for the Chartered Financial Analyst program, offering rigorous treatment of ROE, ROA, and DuPont decomposition. - Ross, S. A., Westerfield, R. W., & Jordan, B. D. (2019). Fundamentals of Corporate Finance. 12th ed. McGraw‑Hill.
A foundational corporate finance textbook that contextualizes ROE within shareholder value creation and capital structure decisions.

 Inar Learn