

Measuring linework in AutoCAD is easy. Totalling it across hundreds of lines, organised by layer, and turning the result into a client-ready report is not. INAR Total Length Studio is a single-file AutoLISP command that reads every selected line and polyline, groups the lengths by layer, drafts a formatted AutoCAD table, and — with one toggle — exports a fully styled Excel workbook with a doughnut chart.
Whether you are summing pipe runs, kerb lengths, cable routes, road centrelines, or drainage networks, the routine replaces the manual counting, the hand-typed schedules, and the inconsistent formatting with a single click.
Load the file with APPLOAD, run INAR-TLEN, configure the dashboard (text style, cell size, alignment, scale, and outputs), select your Lines, 2D Polylines, or 3D Polylines, then insert the table or let the routine write the Excel report for you.
Introduction to INAR Total Length Studio
INAR Total Length Studio is a single-file AutoLISP command (INAR-TLEN) built for engineers, surveyors, quantity surveyors, planners, and CAD technicians who need to quantify linework by layer. It scans the selected geometry, computes each object’s true length, aggregates the results per layer, and delivers two independent outputs — a live CAD table and a styled Excel report — that share the same data.
What it does in one pass
What you get
- A layer-by-layer length summary — every unique layer in the selection becomes a row, with its cumulative length.
- A grand total across all layers, calculated automatically.
- An optional AutoCAD table inserted directly into model space with full control over text style, cell size, alignment, and overall scale.
- An optional Excel workbook (.xlsx) generated through Excel automation, including a professionally styled header, a formatted data table, a bold grand-total row with a live
SUM()formula, and a modern doughnut chart with percentage labels.
Anyone who needs a length schedule from CAD linework: pipe and cable runs, road centrelines, drainage networks, boundary polylines, kerb lines, fencing, trenching, or survey traverses. If you have ever run LIST or DIST on dozens of objects one at a time, this routine replaces that loop.
What Is a LISP Routine?
AutoLISP is the scripting language built directly into AutoCAD. A LISP routine is a plain-text file with the .lsp extension that defines one or more custom commands. Once it is loaded, those commands behave like the built-in ones — you type the name, answer the prompts, and the work is done. No compiler, no SDK, no installer.
What makes this routine useful
Geometry Analysis
Uses vlax-get-property to read the true length of every selected line and polyline — including curved 2D and 3D polylines.
Layer Grouping
Builds an association list keyed by layer name, accumulating the length of every object that shares that layer.
CAD Table Output
Drafts a fully formatted table in the drawing, using your chosen text style and cell dimensions, with live alignment control.
Excel + Chart
Generates a styled .xlsx workbook through a VBScript bridge — including a formatted table and a doughnut chart with percentage labels.
The .lsp file is organised into clearly separated blocks: drawing style scan, DCL generation, geometry collection, table drafting, and Excel export. Reading it top to bottom is the fastest way to learn how a production AutoLISP tool is structured.
Why Is It Important to Use LISPs?
Every CAD office has measurement work — sometimes a quick sanity check, often a full quantity take-off. The difference between a manual loop and a scripted one is measured in hours, and the difference in consistency is measured in client trust.
Manual CAD workflow
- Run
LISTorDISTon each object, one by one. - Write each length into a notepad or a separate spreadsheet.
- Group values by layer by hand — easy to miss a layer or double-count.
- Draw a summary table line by line, formatting every cell.
- Retype the same data into Excel, then build a chart manually.
- Re-run the whole process when the drawing changes.
Automated LISP workflow
- Select the whole set once — every line and polyline is measured in a single pass.
- Lengths are accumulated programmatically — no reading, no copying.
- Grouping by layer is automatic and always complete.
- The CAD table is drafted and styled in one operation.
- The Excel report — including a doughnut chart — is generated automatically.
- Re-run on updated geometry and the report regenerates in seconds.
Six reasons teams adopt LISP routines
Speed
Dozens of manual measurements collapse into one selection and one click.
Accuracy
No numbers are copied by hand — every value is computed and written by code.
Consistency
The same layer grouping, same rounding, same layout for every drawing.
Zero cost
AutoLISP ships with AutoCAD. Nothing additional to buy, install, or renew.
Fits your workflow
The output format — table, Excel, or both — is chosen at run time from the dialog.
Client-ready
The Excel export arrives with a title, a divider, styled headers, and a chart.
Advantages of INAR Total Length Studio
This is not just a length calculator. It is a complete measurement-to-report pipeline with a dashboard at the front and two independent deliverable formats at the back.
Accurate length for every entity type
Lines, 2D lightweight polylines, and 3D polylines are all read through the same vlax-get-property call, so curved polylines, splined segments, and sloped 3D geometry all report true lengths rather than a chord approximation.
Automatic grouping by layer
Each unique layer in the selection becomes a single row, with all the lengths accumulated into it. The result is sorted alphabetically by layer name, so the report reads predictably and layers are never missed or double-counted.
Professional in-drawing table
A title row, a two-column header row, one row per layer, and a bold grand-total row — all sized and styled from your dashboard settings.
Fully styled .xlsx report
Custom title typography, a teal divider, styled headers, a bordered data body, and a highlighted grand-total row with a live SUM formula.
Modern doughnut chart
A floating doughnut chart with a wide hole, white percentage labels, and a clean legend — no manual chart setup in Excel.
Full typographic control
Pick the text style, set the text height, choose the cell width and height, pick one of nine alignments, and apply an overall scale — all from the dialog.
Local execution only
No telemetry, no cloud service, no licence server. Excel is generated on your machine through a temporary VBScript that is discarded immediately.
Non-destructive
The routine only adds a table — it never modifies or deletes the source lines and polylines. A single U at the command line removes the table and returns the drawing to its prior state.
Anyone can sum lengths in a spreadsheet. The value here is that the workbook arrives formatted — with a title, a divider, a header band, a bordered body, a highlighted total, and a chart. Nothing else to style, nothing to build, nothing to copy.
Requirements & Compatibility
Two things are required; everything else is optional and only unlocks extra capability.
Without these, the routine will not run
- AutoCAD for WindowsFull desktop AutoCAD with AutoLISP and Visual LISP (COM / ActiveX) support. Not LT, not Mac.
- Lines or polylinesAt least one
LINE,LWPOLYLINE, orPOLYLINEobject in the selection.
Unlock extra capability
- Microsoft Excel (desktop)Required only for the .xlsx export. If Excel is missing, the CAD table is still produced.
- Windows Script HostBuilt into every Windows installation. Used to run the temporary VBScript that drives Excel automation.
- Civil 3DNot required. The routine works identically in plain AutoCAD and Civil 3D.
Host compatibility
AutoCAD (Windows)
✓ SupportedFull support for the dashboard, CAD table, and Excel export.
Civil 3D
✓ SupportedWorks without modification. Reads standard linework and Civil 3D polylines alike.
AutoCAD LT
✕ Not supportedLT does not expose the COM / ActiveX layer used for tables and Excel automation.
AutoCAD for Mac
✕ Not supportedThe VBScript + Excel automation path is Windows-only.
BricsCAD / ZWCAD
⚠ UntestedCore geometry measurement may work; the DCL dialog and Excel export are not guaranteed.
Download INAR Total Length Studio
Everything the routine needs is contained in a single plain-text file. No installer, no runtime, no licence — just the .lsp file, ready to load with APPLOAD.
INAR Total Length Studio.lsp
The complete AutoLISP length-analytics engine in a single file — including the DCL dashboard, the CAD table generator, and the fully styled Excel workbook with a doughnut chart. Everything is documented inside the source.

Save the file to a permanent folder — for example C:\CAD\Lisp\ — and load it with APPLOAD. Full instructions, including the Startup Suite setup for automatic loading, are in the next section.
How to Install the LISP
Save INAR Total Length Studio.lsp in a permanent folder — for example C:\CAD\Lisp\. Avoid temporary directories, because AutoCAD will remember the path. Then pick one of the two loading methods below.
Load for this session
The quickest path — perfect for trying the routine out or running it once.
- Type
APPLOADand press Enter to open the Load/Unload Applications dialog. - Browse to
INAR Total Length Studio.lsp, select it, and click Load. - Confirm the success message on the command line, then click Close.
Load automatically, every time
The setup you want once the routine has become part of your daily workflow.
- Open
APPLOADand click the Contents button under Startup Suite. - Click Add, select
INAR Total Length Studio.lsp, and confirm. - Restart AutoCAD (or reopen the drawing) to verify the command is available.
If AutoCAD warns about loading from an untrusted location, open the Options dialog, go to the Files tab, and add your LISP folder to TRUSTEDPATHS — or follow your company’s IT policy. Only load LISP files from sources you trust.
Type !c:INAR-TLEN at the command line. If it returns nil, the file did not load. The three usual culprits are SECURELOAD blocking the folder, a typo in the path, or the file having been saved with the wrong extension (for example .lsp.txt).
How to Use INAR Total Length Studio
From a cold start to a finished Excel report takes about two minutes the first time and about twenty seconds thereafter. Follow the seven steps below in order.
Prepare the drawing
Make sure your linework is on the layers you want to report on. The routine groups results by layer, so a coherent layer scheme produces a clean schedule. No geometry is modified by the routine.
Run the command
Type INAR-TLEN at the command line and press Enter. The dashboard dialog opens immediately.
Configure the dashboard
Pick your text style, set the text height, cell width, cell height, alignment (nine options), and overall scale. Then choose your outputs: Insert Professional CAD Table, Export to Styled Excel Workbook, or both.
Select your linework
Click OK, then window-select the LINE, LWPOLYLINE, and POLYLINE objects you want to measure. Press Enter to finish the selection. Anything that is not a line or polyline is ignored.
Place the CAD table
If the CAD table toggle is on, you are prompted to click the insertion point. The table is drafted at that location — title row, header row, one row per layer, and a bold grand total row, all styled from your dashboard settings.
Save the Excel report
If the Excel toggle is on, a standard Save-As dialog appears with a sensible default filename (INAR_Layer_Analytics.xlsx) in the drawing’s folder. Choose a location and confirm — the styled workbook is written in a few seconds.
Review and share
Open the workbook to verify the title, table, grand total, and doughnut chart. The command line reports the number of layers processed and the path of the saved file. If a CAD table was inserted and something is wrong, type U once to remove it.
The CAD table is the only object added to the drawing, and it participates in the standard undo chain — a single U removes it. The Excel workbook is written to disk outside AutoCAD, so delete it manually if you need to.
Dashboard Reference
The dashboard opens the moment you run the command. It is laid out as a two-column dialog — table and content properties on the left, output automation on the right — with a single OK / Cancel at the bottom.
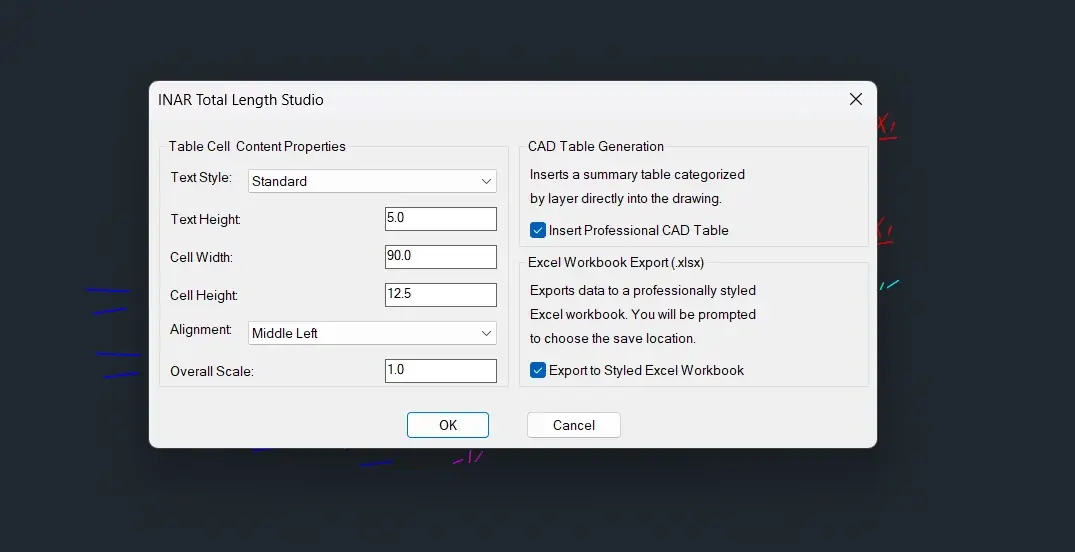
Panel by panel
Text Style
Populated live from the drawing’s STYLE table — every text style defined in the drawing appears in the list. Defaults to the current TEXTSTYLE so the table blends with the rest of the drawing.
Text Height
Base text height in drawing units for every cell. Default 5.0. The value is multiplied by the overall scale before being applied.
Cell Width & Cell Height
Base row height and column width for the CAD table. Defaults 90.0 and 12.5. Both are multiplied by the overall scale, so the table stays proportional if you change the scale.
Alignment
Nine options from Top Left through Middle Center to Bottom Right. Default is Middle Left (index 3). Applied uniformly to every cell for consistent visual balance.
Overall Scale
A single multiplier (default 1.0) applied to the text height, cell width, and cell height. Change it once to adapt the table to a plot scale without editing three separate values.
Output Toggles
Insert Professional CAD Table and Export to Styled Excel Workbook (.xlsx) — both default to on. Switch either off to skip that deliverable.
The text height is in drawing units. If your drawing is in millimetres or at a large plot scale, raise the base height or the overall scale so the table is legible when printed.
Understanding the CAD Table Output
The CAD table is drafted directly into model space at the insertion point you choose. It contains one title row, one header row, one data row per layer, and a bold grand total row. The sample below shows the exact structure.
| Layer Name | Total Length (m) |
|---|---|
| 0 | 128.465 |
| C-ROAD-CENTER | 2452.187 |
| C-STRM-PIPE | 876.320 |
| C-TOPO-CONT-MAJR | 3105.994 |
| GRAND TOTAL: | 6562.966 |
How the values are formed
- Layer name is taken from the entity’s layer (DXF group
8) exactly as it appears in the drawing. - Total length is the sum of every selected object on that layer, formatted with three decimals using
rtoswith units mode 2. - The layer list is sorted alphabetically so the report is stable between runs.
- The grand total is summed after all rows are written and is displayed in the same format.
The header reads “Total Length (m)” as a convenience label. If your drawing is in millimetres, the values are millimetres and the header should be edited after insertion — or the drawing units should be set before running. The routine does not convert between units.
Excel Report Reference
The Excel export is generated through a temporary VBScript that drives Excel automation behind the scenes. The workbook opens ready to share — no formatting required. Below is a visual approximation of what you receive.
Layer Length Analytics
| Layer Category | Total Length (m) |
|---|---|
| 0 | 128.465 |
| C-ROAD-CENTER | 2452.187 |
| C-STRM-PIPE | 876.320 |
| C-TOPO-CONT-MAJR | 3105.994 |
| GRAND TOTAL: | 6562.966 |
What the workbook contains
- Worksheet name — set to Layer Length Analytics.
- Gridlines hidden and the sheet background tinted a soft neutral grey.
- Column A narrowed to 3 as a left margin; Column B at 45 for layer names; Column C at 25 for values.
- Merged title row across B2:C2 — “Layer Length Analytics” in Segoe UI Light, size 28, in the signature light teal.
- Thick dark teal divider across B3:C3 to anchor the title band.
- Header row in dark teal with white bold text and a 22-point row height.
- Data body in white with thin grey horizontal separators and 18-point row height.
- Grand total row in soft teal with a live
=SUM(C6:C{n})formula, bold text, and a strong top border. - Doughnut chart floating below the data with a wide hole (65%), white percentage labels, no chart border or fill, and a clean modern legend.
Nothing is appended to or read from an existing workbook. Each export creates a new file at the location you choose, so you can keep timestamped reports side by side without conflicts.
Limitations to Know About
No routine fits every drawing. These are the boundaries of the current release, grouped by how much they affect your results.
Hard limits
- Lines and polylines only. Arcs, circles, splines, ellipses, and 3D solids are not measured. Convert them to polylines first if needed.
- No layer filtering. Every accepted object in the selection is measured. Select carefully if you only want some layers.
- Windows + AutoCAD only. The COM and VBScript paths mean LT and Mac are not supported.
- Excel export needs desktop Excel. If Excel is missing, only the CAD table is produced.
Behavioural notes
- Units are raw drawing units. The header reads “(m)” by convention; convert downstream if your drawing is in mm, feet, or another unit.
- Layer names are used verbatim. Long or symbol-heavy layer names appear exactly as they are — they are not sanitised or shortened.
- Lengths are reported to three decimals. Rounding is applied at the output stage, not during accumulation, so the grand total is the sum of unrounded values.
- The chart is generated from the data rows only — the grand total is not included in the chart.
Environment dependencies
- VBScript via Windows Script Host. Standard on Windows, but blocked by some enterprise security policies.
- Excel macro-security settings can prevent the workbook from being created if automation is disabled.
- Very large selections run slower. Each entity is measured individually, and the CAD table grows one row per unique layer.
For contractual, quantity-surveying, or construction deliverables, spot-check a few layers against LIST or AREA before issuing the data. The routine is designed to be correct and consistent, but a manual verification on a sample is a good habit to keep.
Troubleshooting
Most problems fall into four buckets: the file will not load, the selection is wrong, the outputs are wrong, or the environment is missing something. Find your symptom below.
Loading the routine 2 issues
Unknown command “INAR-TLEN”
The file has not been loaded in the current session.
Run APPLOAD and load the file, or add it to the Startup Suite so it loads automatically in future sessions.
“Error loading DCL”
The temporary dialog file could not be created — usually a temp-folder permission issue or a full disk.
Check that the Windows temp folder is writable, free up disk space if necessary, then rerun the command.
Selection & geometry 2 issues
“No valid lines or polylines selected”
The selection was empty, or nothing in it matched the accepted entity types.
Select LINE, LWPOLYLINE, or POLYLINE objects. Arcs, splines, circles, and blocks are ignored — explode or convert them first if needed.
Table is empty or a layer is missing
One or more objects were not actually in the selection when you pressed Enter.
Use a crossing window that fully encloses the layer’s linework, then check the command line for the entity count. Rerun and confirm each expected layer appears as a row.
Outputs & results 2 issues
Table text height looks wrong
Either the base text height or the overall scale is out of step with the drawing’s plot scale.
Delete the table with U, rerun the command, and adjust the text height or the overall scale in the dashboard before pressing OK.
Excel file is written but the chart is missing or plain
Chart styling depends on the installed Excel version. Some very old versions do not support the DoughnutHoleSize property.
The chart data is always generated; the styling falls back gracefully. Update Excel to a current release to see the wide-hole doughnut with white percentage labels.
Environment & external tools 2 issues
Excel file is not created at all
Excel is missing, blocked by policy, or a macro-security setting is preventing COM automation.
Install or repair desktop Excel, or leave the Excel toggle off. The CAD table is still produced regardless — the drawing-side deliverable is unaffected.
VBScript is blocked by security software
Some enterprise policies disable Windows Script Host or block wscript.exe from running temporary scripts.
Ask IT to allow wscript for your user account, or turn off the Excel toggle and use the CAD table output instead.
Best Practices
Eight habits that turn a working tool into a reliable part of your daily measurement and reporting workflow.
Use a coherent layer scheme
The report is grouped by layer, so a well-organised drawing produces a well-organised schedule. If you need finer grouping, split the geometry across layers before running the routine.
Confirm your drawing units
The header reads “(m)” but the routine reports raw drawing units. If your drawing is in millimetres, either edit the header after insertion or convert the values in Excel.
Match the table to the plot scale
Use the overall scale to adjust the whole table in one go. Test on a small selection first, then lock in the values before running the full drawing.
Pilot on a small selection
Before processing a whole drawing, run the routine on a handful of layers to verify the table, the styling, and the Excel output all look the way you expect.
Save the Excel report alongside the drawing
The default save path is the drawing folder. Accept it unless you have a project-specific reports folder, so the drawing and its analytics stay together.
Spot-check the grand total
On any contractual take-off, verify the grand total against LIST on a small sample. The routine is designed to be consistent, but a manual sanity check is cheap insurance.
Keep a standard copy in a shared location
Store the .lsp file where the whole team can reach it, so everyone runs the same version and produces the same report format.
Add the table to your title block when needed
For deliverables that require a printed length schedule, place the CAD table on a dedicated layer and include it in your sheet layout so it appears on the plot.
Frequently Asked Questions
What is the command name?
Type INAR-TLEN at the command line after loading the file.
Which entity types can be measured?
Lines (LINE), lightweight polylines (LWPOLYLINE), and legacy polylines (POLYLINE). Arcs, circles, splines, ellipses, and 3D solids are not measured. If you need to include them, convert them to polylines first — with PEDIT or FLATTEN — and rerun the routine.
Does it work in Civil 3D?
Yes. Civil 3D inherits AutoCAD’s full AutoLISP and Visual LISP capabilities, so the routine runs identically. Standard linework and Civil 3D polylines are both measured.
What units are reported?
Raw drawing units. The table header reads “Total Length (m)” as a convenience label, but the values are not converted. If your drawing is in millimetres, the values are millimetres and you should adjust the header or convert in Excel.
Can I export both the CAD table and the Excel workbook?
Yes. Both toggles default to on, and the routine writes both from the same dataset in the same run.
Do I need Excel to be installed?
Only for the Excel export. If Excel is missing or blocked, the CAD table is still produced. Turn off the Excel toggle if you only want the in-drawing report.
Will the routine change my linework?
No. It only reads the geometry and adds a table. The source lines and polylines are never modified, moved, or re-layered.
Can I undo a run?
Yes. The CAD table participates in the standard undo chain, so a single U at the command line removes it. The Excel workbook is written to disk outside AutoCAD — delete it manually if you need to.
Why does the Excel chart look plain on my machine?
Chart styling depends on your installed Excel version. Older releases may not support the wide-hole doughnut or white percentage labels. The data and layout are always generated; update Excel for the full visual effect.
Is it safe to run a LISP file?
A LISP file runs with the same permissions as AutoCAD, so only load files from sources you trust. The file is plain text, so you or your IT team can read it before using it.
Key Takeaways
- INAR Total Length Studio measures every selected line and polyline and aggregates the result by layer in one pass.
- It produces two deliverables from the same dataset — a formatted AutoCAD table and a styled Excel workbook.
- Load it with
APPLOAD, then runINAR-TLEN. - The dashboard gives full control over text style, text height, cell size, alignment, and overall scale.
- The Excel export includes a merged title row, a teal divider, styled headers, a bordered data body, a live SUM grand total, and a doughnut chart.
- It works in plain AutoCAD and Civil 3D; Excel and Windows Script Host are only needed for the spreadsheet export.
- Only lines and polylines are measured, and the values are in raw drawing units.
- The routine never modifies existing geometry, and a single undo removes the table.
Need More Help?
Learn more CAD automation
Explore more tutorials, LISP routines, and step-by-step guides at InarLearn.com.
Visit Inar Learn
 Inar Learn
